Data life cycle
The data life cycle model shows the flow of information through the data, design and technology practices in Health. How we capture data, analyse it and then use it to make effective decisions.
How information flows in Health
The data life cycle is a series of points, or ‘themes’, that data passes through in its journey from when a thing happens, to a decision that’s made using evidence of the thing, to iterations based on measurement of the decision. It’s a constant set of feedback loops that lets us see if what we’re doing at each point is right.
Ryan Dunn, data lead, describes how it works in this video. It’s an excerpt from a talk Ryan and team Teal did at Services Week 2022. You can see the full talk in the Services Week playlist on YouTube (opens in new tab).
To view the video in full-screen mode, open the video in the Stream AMG player (opens in new tab) and use the ‘play video full screen’ button in the toolbar
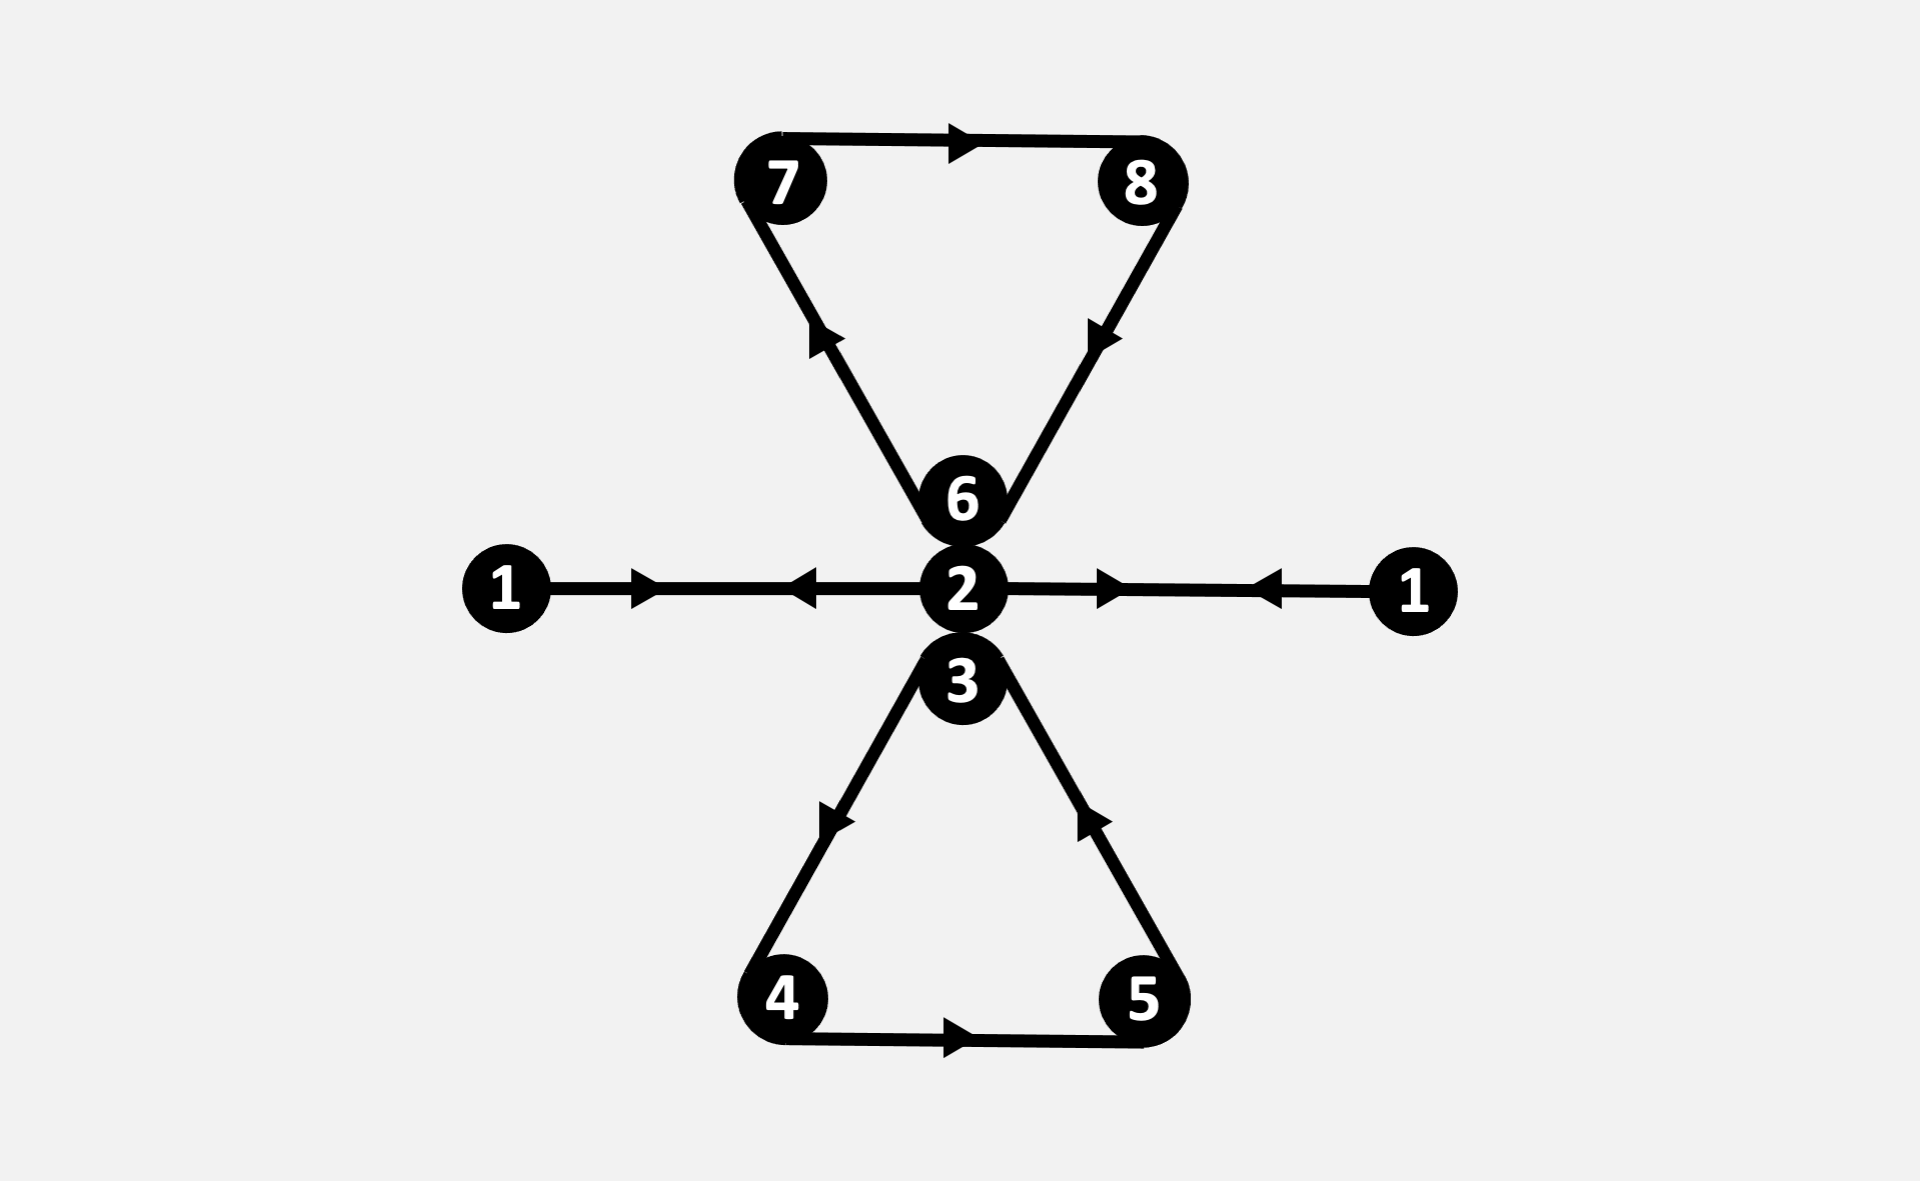
What the numbers in the diagram mean
The numbers in the diagram represent 8 themes, or points, within the data life cycle:
-
Transparency and decision making needs
-
Reporting, recording and retaining information
Decisions take place on an axis between business strategy and service users. We need accurate and timely data to make those decisions fair, robust and understandable. To do this, we need to make the decision-making process and its use of data more transparent.
Points 1 and 2 in the diagram, and the axis between them, look at where decisions are made, what forums they’re made in, and what information is used to make those decisions. And how we can start to influence the behaviours, values and motivations within those forums and meetings. Then how we record, report and retain all that information.
-
Shared infrastructure and components
-
Data design
-
Data capture
Points 3, 4 and 5 in the lower part of the model relate to technology practices, for example, engineers and architects. This is where development and artefacts live. Artefacts include code and other things, such as technical designs, that are delivered.
-
Data and service optimisation
-
Analysis
-
Measurement and hypotheses
Points 6, 7 and 8 in the upper part of the model relate to data practice. We analyse data to learn what’s happening, then use it as evidence for measurement and hypotheses, which we then use to plan and optimise services. The data comes from points 3, 4 and 5 in the lower part of the model.
We go around the figure of 8 loop many times, recording and reporting on all of the information and progress as we go.